The Curious Case for Emerging Markets
In last week’s post, I wrote about the evolution of Emerging Markets investing over the last ~40 years. In it, I shared this tweet from Morgan Housel:
2007: "Emerging markets will generate higher returns, but expect lots of volatility."
— Morgan Housel (@morganhousel) September 6, 2018
[lots of volatility happens]
2018: "Why would you invest in emerging markets? They're so volatile."
It reminded me a lot of Howard Marks’ often cited “risk and return” charts. The first one represents how most people typically think of the relationship between risk and return:
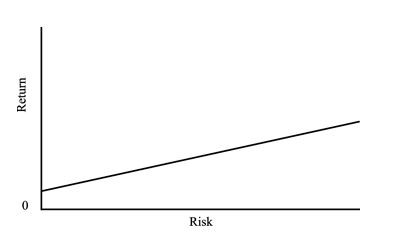
The second one depicts how that relationship *actually* works:
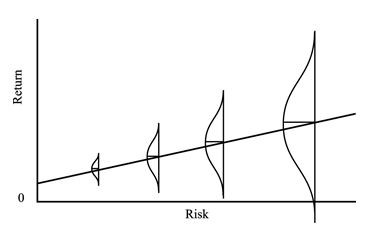
The only constant in Emerging Markets – besides change – is higher risk and volatility than that of Developed Markets. So how exactly has that additional risk manifested itself throughout history? Let’s take a look…
What to Expect When You’re Expecting (Higher Volatility)
The standard deviation of the MSCI Emerging Markets Index from January 1988 through August of this year was 22.57%. Over that same period, the standard deviation of the S&P 500 was 13.97%. Sure, one number is higher than the other, but standard deviation doesn’t tell you much about what the experience of owning Emerging Markets has felt like.
My friend Jared Kizer, who writes at the blog Multifactor World, recently shared this interactive chart (click the play button) comparing the annual maximum drawdowns of the MSCI Emerging Markets Index to those of the S&P 500. Compared to standard deviation, drawdowns provide a much better sense of what downside volatility – the only type of volatility people care about – has actually felt like.
<insert video>
Corrections and Bear Markets are par for the course in EM. Ben Carlson over at A Wealth of Common Sense recently wrote a great piece that highlighted the numerous corrections and bear markets that have occurred within the MSCI Emerging Markets Index since 1994.
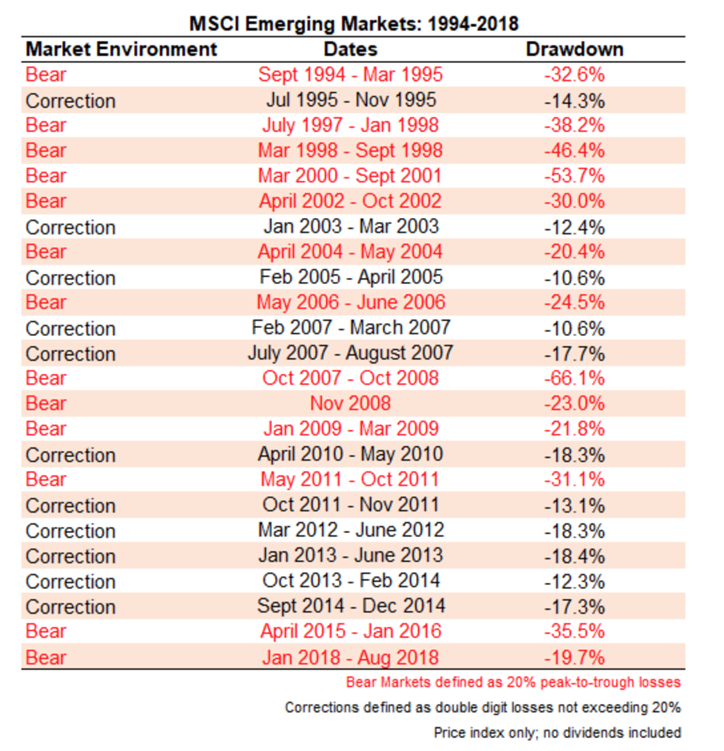 Source: Ben Carlson, A Wealth of Common Sense
So why even bother with Emerging Markets, given what we know about their propensity for episodic tremors? I’m glad you asked.
A Differentiated Return Stream
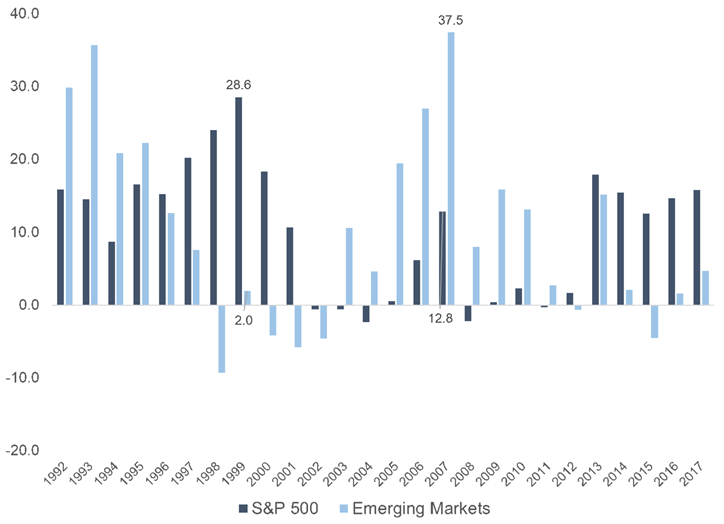
It should come as no surprise that the frequency and magnitude of historical drawdowns has resulted in a different return profile for Emerging Markets compared to U.S. stocks. Just how different returns have been might surprise you though. This next chart (also from Ben) breaks the roughly 30 year period from 1988-2018 into four sub-periods that reflect different market cycles.
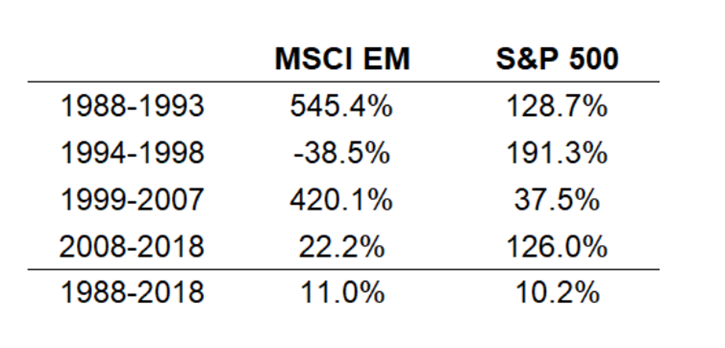
Source: Ben Carlson, A Wealth of Common Sense
Jared Kizer puts a slightly different twist on it, looking at rolling five-year annualized returns from 1988 through the end of 2017. If you invested in EM in the early 1990’s or the early to mid 2000’s, you looked like a genius. Had you done the same during the Tech Bubble or since the Global Financial Crisis, a buffoon.
Source: Jared Kizer, Multifactor World
It’s mind blowing just how far apart 5-10 year returns can be for these two segments of the global equity market, particularly when you take into account that the full period returns are almost identical. Since the inception of the MSCI Emerging Markets Index in 1988 through August of this year, EM returned 10.84% annualized while the S&P 500 returned 10.80%. Despite the eerily similar gains, a blend of the two, rebalanced annually, would have yielded better results. Over the same timeframe:
- 90% S&P 500/10% MSCI Emerging Markets: 11.10% annualized
- 85% S&P 500/15% MSCI Emerging Markets: 11.23% annualized
- 80% S&P 500/20% MSCI Emerging Markets: 11.34% annualized
These incremental return enhancements would have been accompanied by volatility not materially higher than owning solely the S&P 500, thanks to the risk management benefits offered by diversification and rebalancing.
A Significant Slice of the Global Equity Pie
I made mention of this in last week’s post, but it bears repeating:
- Near their infancy, Emerging Markets represented an infinitesimal percentage of the global equity market capitalization. At end of last year, EM represented over twelve percent of the global opportunity set.
- There are well over six thousand publicly trades stocks in the twenty four Emerging Market countries, with a total value of roughly $7 Trillion with a “T.”
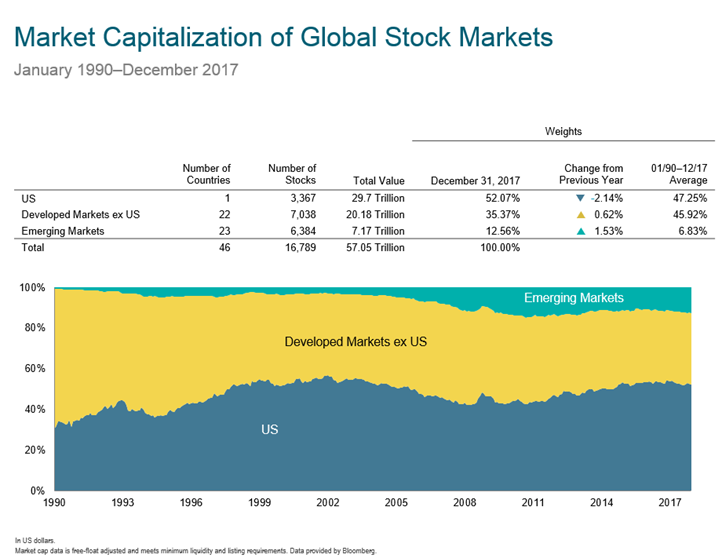
Source: Dimensional Fund Advisors
Forgoing nearly one-eighth of the investable universe of stocks is making a substantial and explicit bet, whether you realize it or not.
Factors Have “Worked” in Emerging Markets
On balance, the excess returns earned from tilting towards the Size, Value and Profitability factors in Emerging Markets has been comparable to those in the U.S. and Developed Ex-US stock markets.
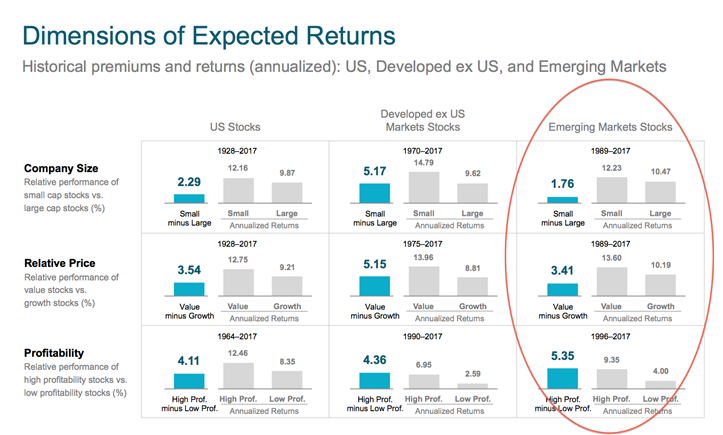
Source: Dimensional Fund Advisors
I put the word works in quotations in the section header for a reason.The things that “work” in investing tend to work slightly more than they don’t over shorter time periods. As AQR’s Cliff Asness likes to say, “if your car worked like this, you’d fire your mechanic!”
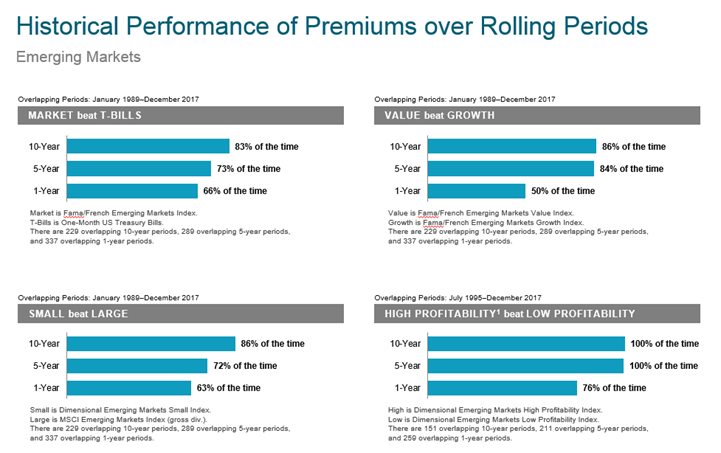
Source: Dimensional Fund Advisors
But still, if you look at historical five or ten year periods, there has been a high probability that these factors have added value. What’s more, there may be some diversification benefit in the sense that when certain factors are struggling domestically – I’m looking at you, Value – those same factors might be delivering abroad.
An Attractive Entry Point?
To say that GMO, an asset management firm widely known for their long-term market forecasts, has a pretty pessimistic outlook for the major asset classes is putting it mildly. (Please note that the numbers displayed below are in real terms, i.e. net of expected inflation.)
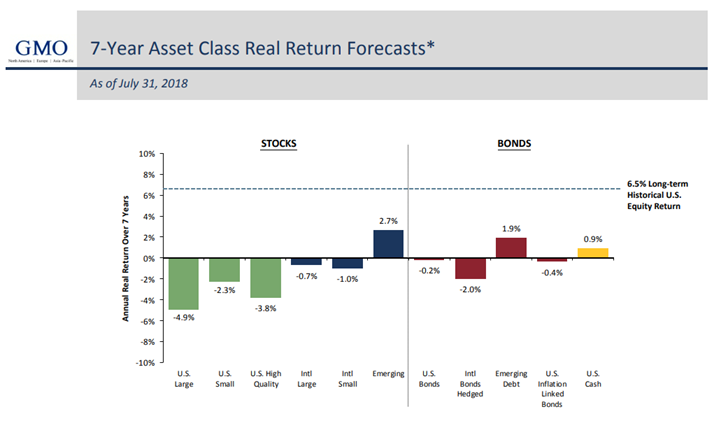 Source: GMO
The one area that they are somewhat sanguine about is Emerging Markets, both equity and debt. GMO is not alone – Research Affiliates and J.P. Morgan are two other examples of firms known for their long-term capital market assumptions that are expecting better relative performance from EM than the rest of the world over the next decade. It’s important to note that while valuation has modest long-term predictive value, it tells you nothing about what short-term results might be. Even if the long-term trajectory is “better than average” returns, the path to get there won’t necessarily be a cakewalk.
And if you’re wondering whether it has historically paid off, on average, to buy EM after there is “blood in the streets”, go ahead and read this follow-up piece that Ben wrote that shows how EM has performed in the subsequent one, three, and five year periods following twenty and thirty percent declines. (SPOILER ALERT: it has usually paid off handsomely.)
What’s happening this year is not the first Emerging Markets crisis, and it will certainly not be the last. I hope that the information and context shared above demonstrates that for most investors, there is a very strong case to own Emerging Markets for the long-term as part of a strategic asset allocation in spite of the inevitable crises.
In closing, I’d like to paraphrase something that Adam Butler from ReSolve Asset Management tweeted in response to my first post in this series:
An investment in emerging markets is a bet is on the expanding prosperity and innovation of our species.
Additional Reading:
A Short History of Emerging Market Corrections & Bear Markets (A Wealth of Common Sense)
Buying Emerging Markets During a Disaster (A Wealth of Common Sense)

About the author
Phil Huber, CFA, CFP®
Phil is the Head of Portfolio Solutions for Cliffwater, a leading alternative investment adviser and fund manager. Prior to joining Cliffwater in 2024, Phil was the Chief Investment Officer for Savant Wealth Management, a multi-billion dollar wealth management firm. Phil has been involved in the financial services industry since 2007. He earned a bachelor’s degree in finance from the Kelley School of Business at Indiana University. He is a member of the CFA Society of Chicago. More about me here. Twitter: @bpsandpieces
Get on the List!
Sign up to receive the latest insights from Phil Huber directly to your inbox.