Are Active Funds Lower Risk Than Passive Funds?
Over the last decade, the rocketship known as index investing has crippled the ability of traditional active fund managers to gather assets. The emergence of systematic, factor-based mutual funds and ETFs – which our industry has begrudgingly coined as “Smart Beta” – has only exacerbated the trend as investors can now seek outperformance via low-cost, transparent, rules-based strategies that aren’t predicated on finding the next Peter Lynch. Disciples of index investing that grew tired in their quest for alpha often point to the Arithmetic of Active Management argument, made famous by William Sharpe, as their raison d’être. It states:
If “active” and “passive” management styles are defined in sensible ways, it must be the case that:
(1) before costs, the return on the average actively managed dollar will equal the return on the average passively managed dollar and
(2) after costs, the return on the average actively managed dollar will be less than the return on the average passively managed dollar
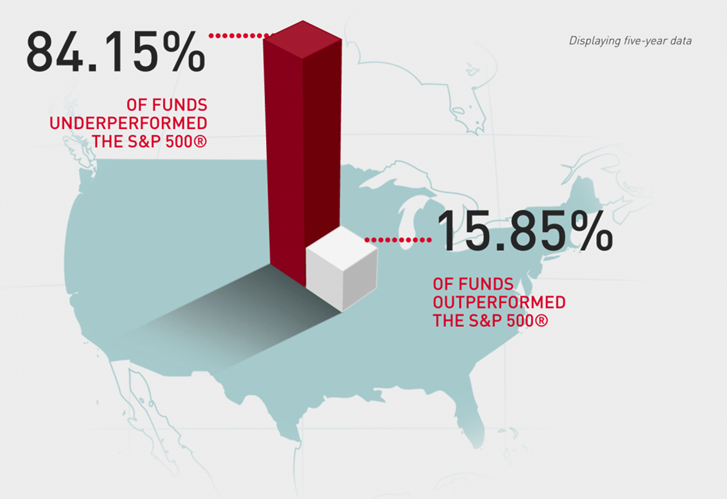
One of the most damning arrows in the quiver of passive investing advocates is the regularly updated S&P Index Versus Active (“SPIVA®”) Scorecard, which has consistently debunked the notion that active managers as a whole can outperform their benchmarks, net of fees and expenses. The evidence in these scorecards goes a great way in explaining the waterfall of assets that have waved bye-bye to “stock pickers” and hello to market tracking funds and their factor-based cousins. Here is just one example showing the average performance of all actively managed U.S. Large Cap funds relative to the S&P 500 over the past five years:

Source: S&P Dow Jones SPIVA Scorecard
The SPIVA Results are updated twice a year, but the story remains the same each and every time:
- The majority of active funds, regardless of time period measured, underperform their benchmark.
- Fees have a major impact on fund performance.
- The notion that so called “less efficient markets” like small-cap stocks and emerging markets offer more low hanging fruit is entirely debunked.
Perhaps bored from seeing the same result every six months, Craig Lazzara and his team at S&P Dow Jones Indices decided to tackle the Active/Passive debate from another angle: Volatility.
In the absence of compelling performance numbers to justify their fees, active fund shops have turned to risk management as their last vestige of hope in retaining and (perhaps one day again) attracting investors. The paradigm has shifted away from touting absolute outperformance and into emphasizing the ability to offer higher risk-adjusted returns. Our cognitive biases lead us to suffer more from the agony of loss than we would take pleasure in an equivalent gain. Fund marketers know this, which is why investment products have been and always will be designed and launched to fight the last war. It’s also explains why our ears perk up when managers opine on upside participation without all that pesky downside.
So what does the evidence show?
Here are some of the key findings from the study (with my comments below each):
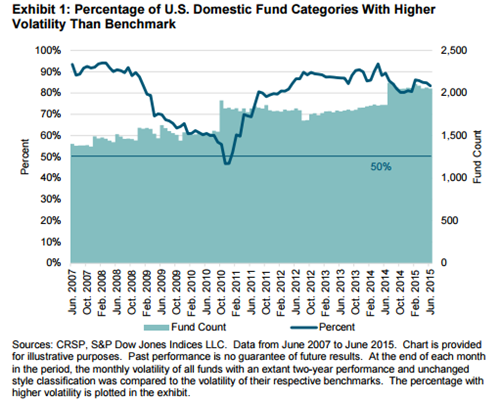
1) Typically, active funds offered higher risk than comparable benchmarks—although not always and not in every fund category.
Much to the chagrin of the marketing and sales people at traditional stock-picking firms, another myth is busted as there is no evidence that as a whole, actively managed funds provide a lower volatility experience to their investors. In fact, during the time period measured, there was only one brief period (measure by the dark blue line) towards the end of 2010 that active funds as a whole were less volatile than their benchmark.

2) There is persistence in relative fund volatility, particularly for the most and least volatile funds.
We’ve all seen the “Past performance is not indicative of future results” disclaimer that fund companies use (as required by the SEC) in magazine ads and TV commercials. But what about volatility? Is past volatility indicative of future volatility? Turns out, yeah sort of. At least at the extremes.
3) The performance of high-volatility funds appears to stem from a bias toward higher-beta stocks.
4) The performance of low-volatility funds appears to be driven by large cash allocations.
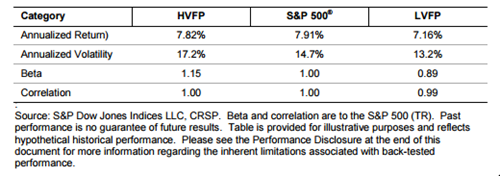
In addition to looking at the volatility of active managers as a whole, the researchers built a portfolio of higher-volatility funds (HVFP) and a portfolio of lower-volatility funds (LVFP) and compared them to the S&P 500 over the last decade. Here are the results:

The numbers in the table above for the HVFP column are not terribly surprising. There is decades of evidence that has shown that against our intuition, investors have not been commensurately rewarded with higher returns by owning higher-beta and higher-volatility stocks. On the flipside, evidence has shown that lower-volatility stocks have historically exhibited higher risk-adjusted returns than the market. The risk-adjusted performance of the S&P and the LVFP are essentially the same. This is consistent with the authors finding that the bulk of volatility reduction achieved by the funds in the LVFP came not from the stocks themselves but rather the amount of cash they held.
A few closing thoughts:
- If you are going to use volatility as an input in your manager selection process, avoidance of high volatility managers may prove more beneficial than a focus on low volatility managers.
- With much of the performance of low-volatility funds attributable to higher cash holdings as opposed to the selection of low-volatility stocks, perhaps a more efficient and cost effective way to reduce risk would be lowering one’s equity allocation rather than overpaying a manager to hold excess cash.
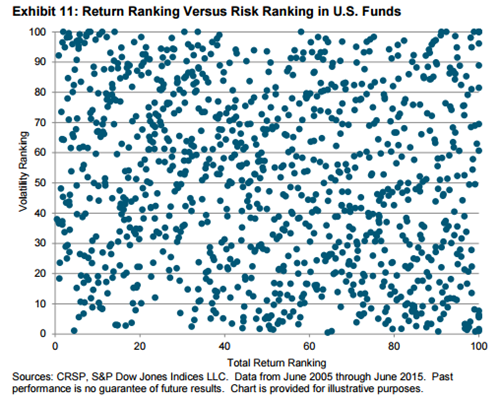
- A fund’s volatility ranking, whether high or low, still has no predictive value on it’s return:

- There’s nothing wrong with pursuing an equity strategy focuses on low-volatility stocks – provided you can stick with it during the inevitable periods of underperformance. Just keep this (slightly modified) disclaimer in mind: “Past volatility is not indicative of your future results and – more importantly – your behavior”
If you’re interested in reading it, the full study can be found here:
Get on the List!
Sign up to receive the latest insights from Phil Huber directly to your inbox.

