Started From the Bottom, Now We're Here
Yesterday marked the two-year anniversary of the stock market bottom of 2020. It may not feel like it now, but if we're being honest with ourselves, we were definitely still in peak uncertainty and peak fear mode. We know now (with the benefit of hindsight) that was the day the news started getting less bad - even though in many ways the news would get worse and worse over the subsequent year.
It's remarkable how vastly different the financial market landscape looks today than it did at the same point in 2020.
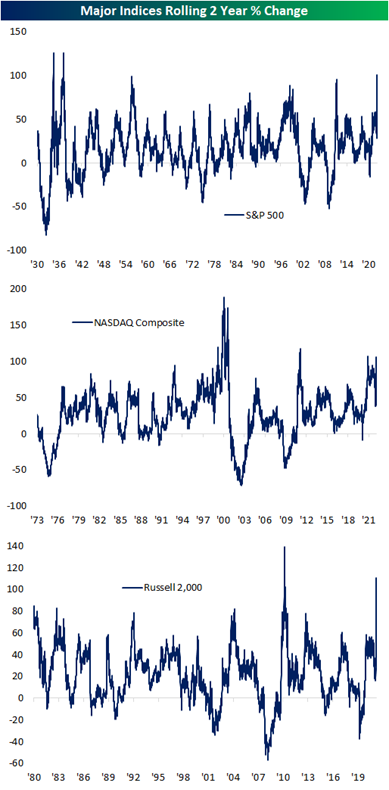
Despite the recent weakness, the stock market results from the past two years are ones for the record books. The chart below from Bespoke Investment Group shows the rolling two-year performance of the S&P 500, NASDAQ, and the Russell 2000 and all three rank among the highest readings seen since the aftermath of the GFC.
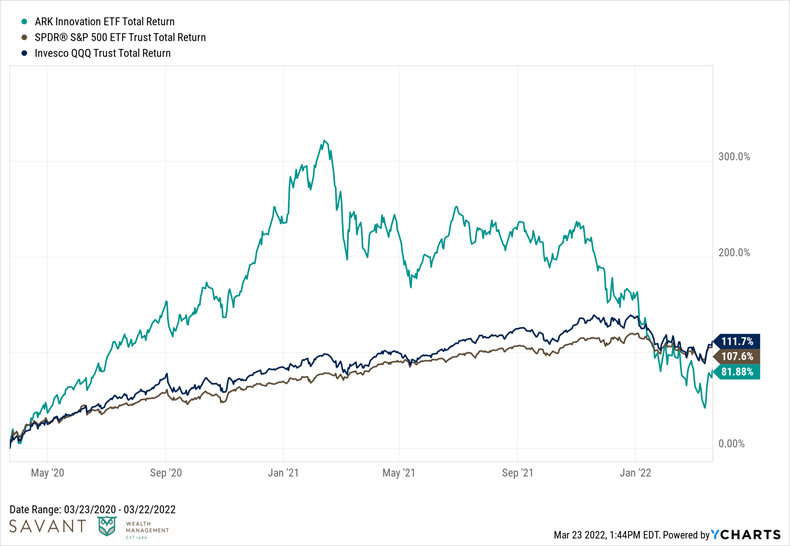
A lot of themes that emerged from the 2020 bottom in the stock market ultimately fizzled out as those things tend to do. Active management was once again in vogue - partially one active manager, Cathie Wood of ARK Investments. She cultivated an almost cult-like following with the performance of her firm's suite of ETFs, including their flagship ARK Innovation ETF. Ultimately, the tree couldn't grow to the sky and despite ARKK's astronomical returns in 2020, it is now trailing both the S&P 500 and the Nasdaq 100 over the past two years. Easy come, easy go.
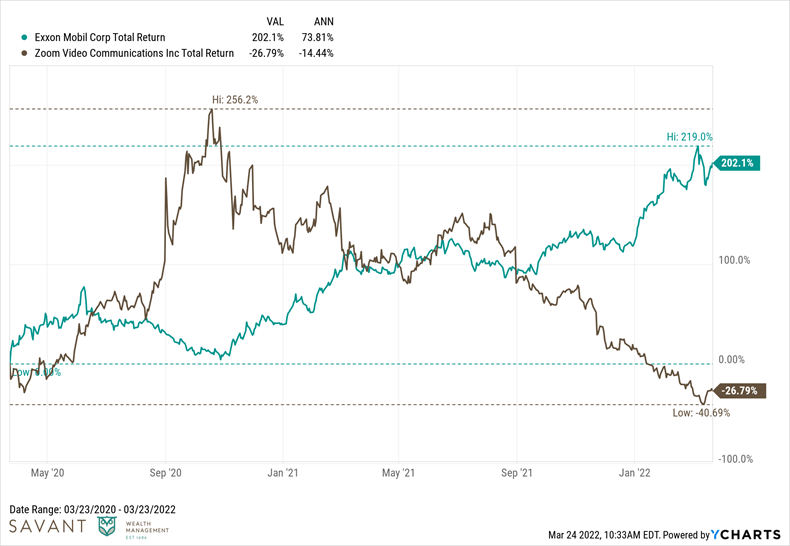
"Stay at home" stocks were very much a thing two years ago as many of us got acclimated to an unfamiliar work-from-home environment. It's hard to think of two stocks more emblematic of the pre-Covid and post-Covid economies than Exxon Mobil and Zoom, respectively. The former was seemingly left for dead, and the latter became a verb. Two years hence, Zoom is now trading nearly 30% below where it was at the 2020 bottom and Exxon (along with the entire energy complex) are one of the few areas of the market still on fire.
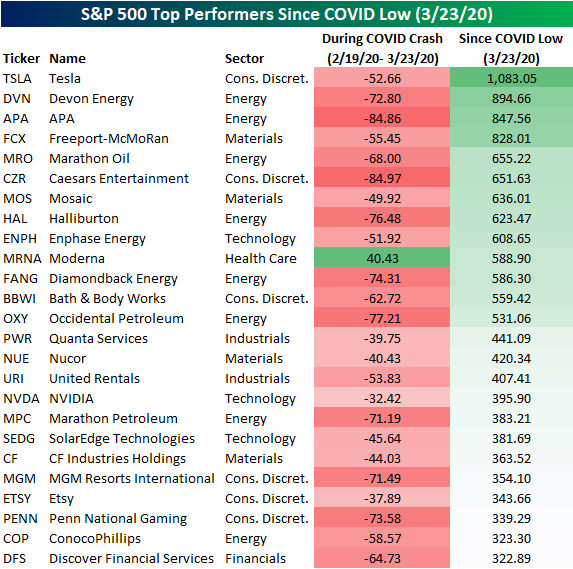
It's worth taking a look under the hood of everyone's favorite U.S. stock market proxy, the S&P 500, to see what the best performing large-cap stocks have been over the past two years. There's something very *chef's kiss* about the top 10 being bookended by two pandemic stock market poster children - Tesla and Moderna - with the remainder consisting almost entirely of "dirty" old-world energy and materials names. Stock picking is hard.
To no-one's surprise, credit spreads blew out in February-March 0f 2020, as they tend to do in periods of high volatility and limited liquidity. The chart below shows where high yield spreads were two years ago for high yield corporate bonds as well as investment grade bonds rated A or BBB.
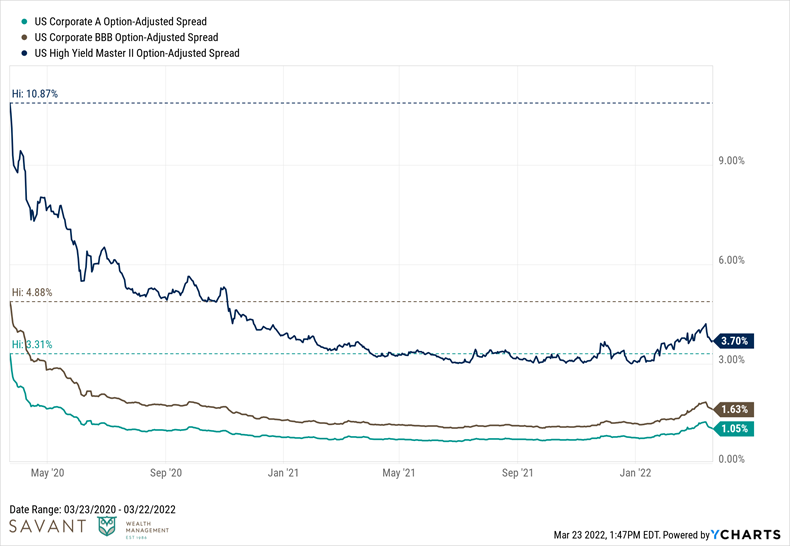
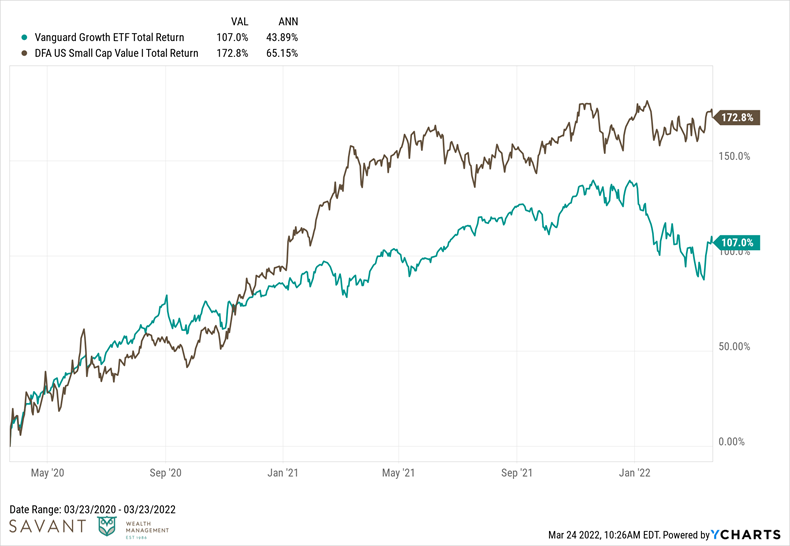
Verdad's Dan Rasmussen has published a ton of great research on "crisis investing" and his primary indicator in determining whether or not there is "blood in the streets" is the level of high yield spreads. We were certainly there in March of 2020. The silver lining is that a lot of Dan's research supports that those are great environments to be buying stocks, on average. Specifically, small cap value stocks tend to do exceedingly well, in both absolute and relative terms, following periods of high yield spreads going above 6 percent. That certainly played out in textbook fashion, with small cap value stocks going gangbusters and materially outperforming large cap growth in the process.
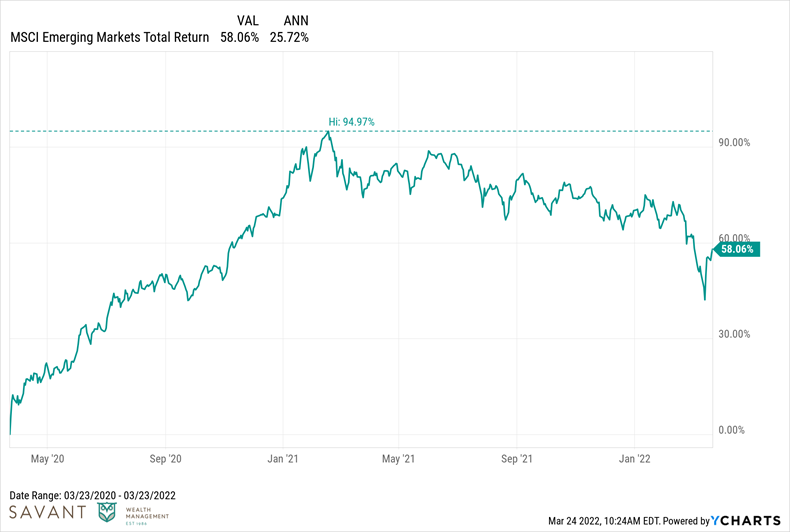
Stock market returns have been a bit lopsided across the globe, however. While Emerging Market stocks came out of the gate strong in March 2020, they have been relatively weak over the past year. This owes in large part to the performance of Chinese equities, which represent the single-largest country allocation within almost every EM index.
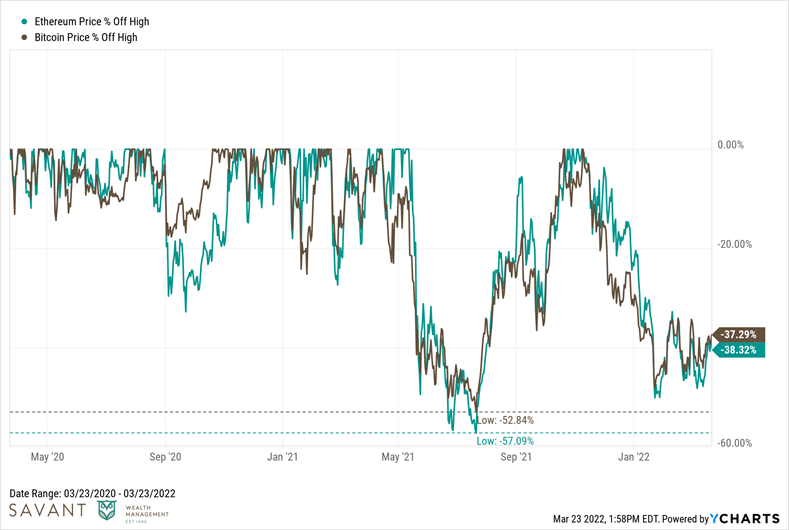
I'd be remiss if we didn't touch on crypto, which officially graduated to mainstream status in the post-Covid world. To state the obvious, the returns to Bitcoin and Ethereum, the two "blue chip" digital assets, have been mouth-watering.
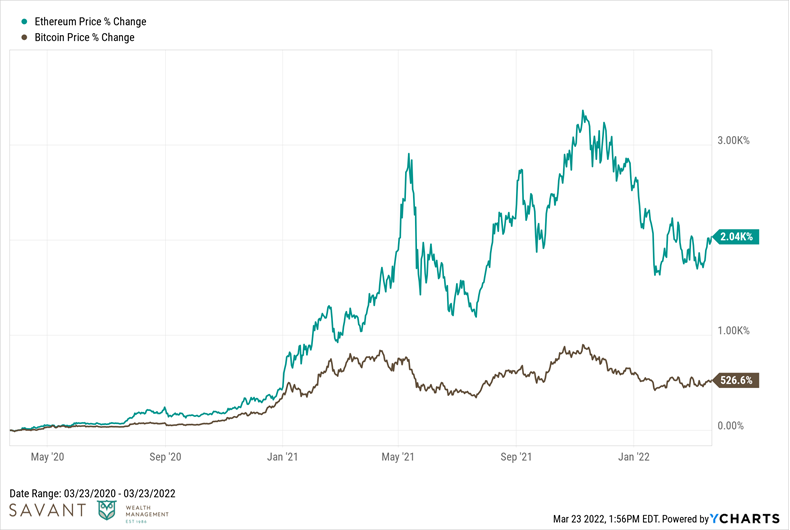
Earning said returns, however, has not been easy. Both assets have experienced several 20% percent drawdowns over the past couple years and each has been cut by more than half once.
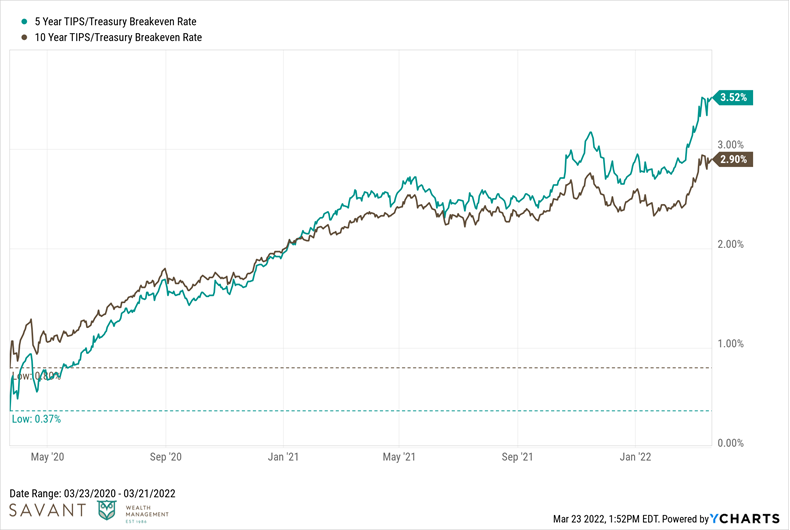
And now we get to the elephant in the room - inflation. Not a single variable or topic has come up more in client meetings over the past year. It's top of mind for both Wall Street and Main Street alike. Two years prior, we had the opposite concern - that of deflation. The chart below shows the path of market-implied expectations for inflation over the next five and ten years. At the lows, the market was pricing in long term inflation below one percent. Today, the market expects roughly 3.5% over the next five years and nearly 3% over the next ten. For context, the long-term historical average for inflation has been ~3 percent.
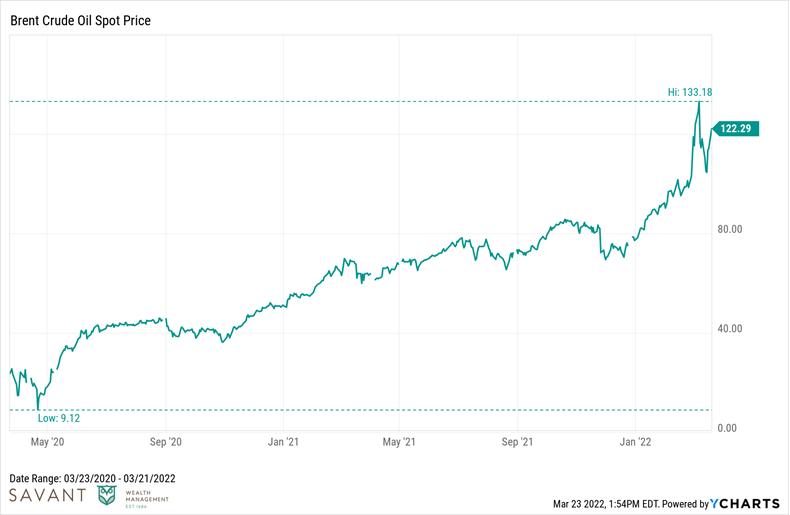
One area in which inflation has been most pronounced has been in energy prices. The price of Brent Crude oil currently hovers above $120/barrel, a far cry from that fateful day of April 20, 2020, which saw the front-month May 2020 WTI crude contract settle at negative $37.63 a barrel on the New York Mercantile Exchange. That day will live on in infamy as one of the greatest meme days in Finance Twitter history. I'm particularly proud of this one.
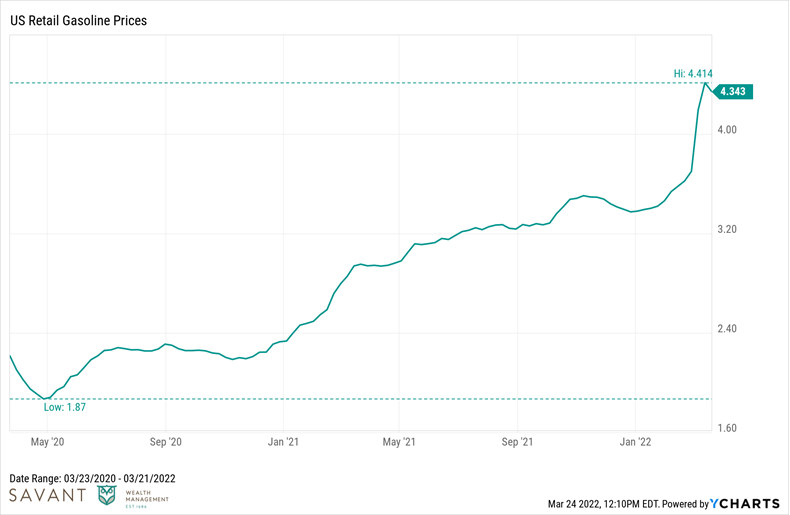
Consumers are certainly feeling the pinch at the pump, with gas prices more than doubling from the levels seen in early 2020.
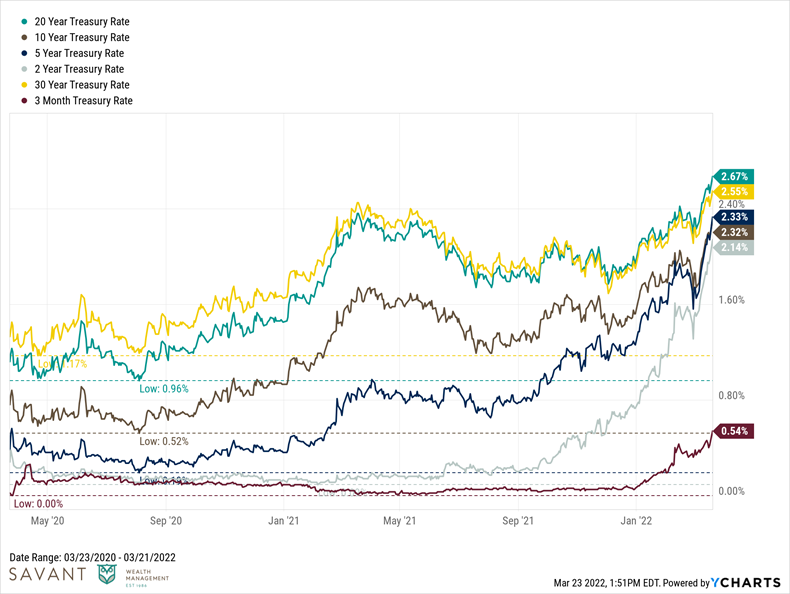
While the much higher YoY CPI numbers will eventually settle down from current levels, there is clearly still a disconnect between interest rates and inflation. The accommodative stance held since the onset of the pandemic is no longer necessary for the economy to stand on its own two feet, and bond markets have been rapidly repricing their expectations of the Fed's tightening schedule. While the absolute numbers don't seem like much given the low starting levels, the rapid rise in rates across the yield curve has led to the worst start of the year for bonds in decades.
The classic 60/40 portfolio has served investors well for many years, but this year has demonstrated that inflation can be the Kryptonite that causes traditional stock and bond mixes to fall in concert. Fortunately, investors today have alternative levers they can pull to add diversification to their portfolios. Hey, someone should write a book about that!
I could bore you with a laundry list of investment lessons learned from the past two years, but I think it can be boiled down to this:
- It reinforced the futility of market timing.
- It reminded me that the only thing for sure is that nothing's for sure.

About the author
Phil Huber, CFA, CFP®
Phil is the Head of Portfolio Solutions for Cliffwater, a leading alternative investment adviser and fund manager. Prior to joining Cliffwater in 2024, Phil was the Chief Investment Officer for Savant Wealth Management, a multi-billion dollar wealth management firm. Phil has been involved in the financial services industry since 2007. He earned a bachelor’s degree in finance from the Kelley School of Business at Indiana University. He is a member of the CFA Society of Chicago. More about me here. Twitter: @bpsandpieces
Get on the List!
Sign up to receive the latest insights from Phil Huber directly to your inbox.